
How much Fairer is Fair 2022
CBO Distribution of Household Income 2022

The Congressional Budget Office (CBO) has released its latest, 2022, analysis of the distribution of household income. This report lags by several years because the study relies on the combination of census data and a detailed analysis of tax returns by the Treasury.
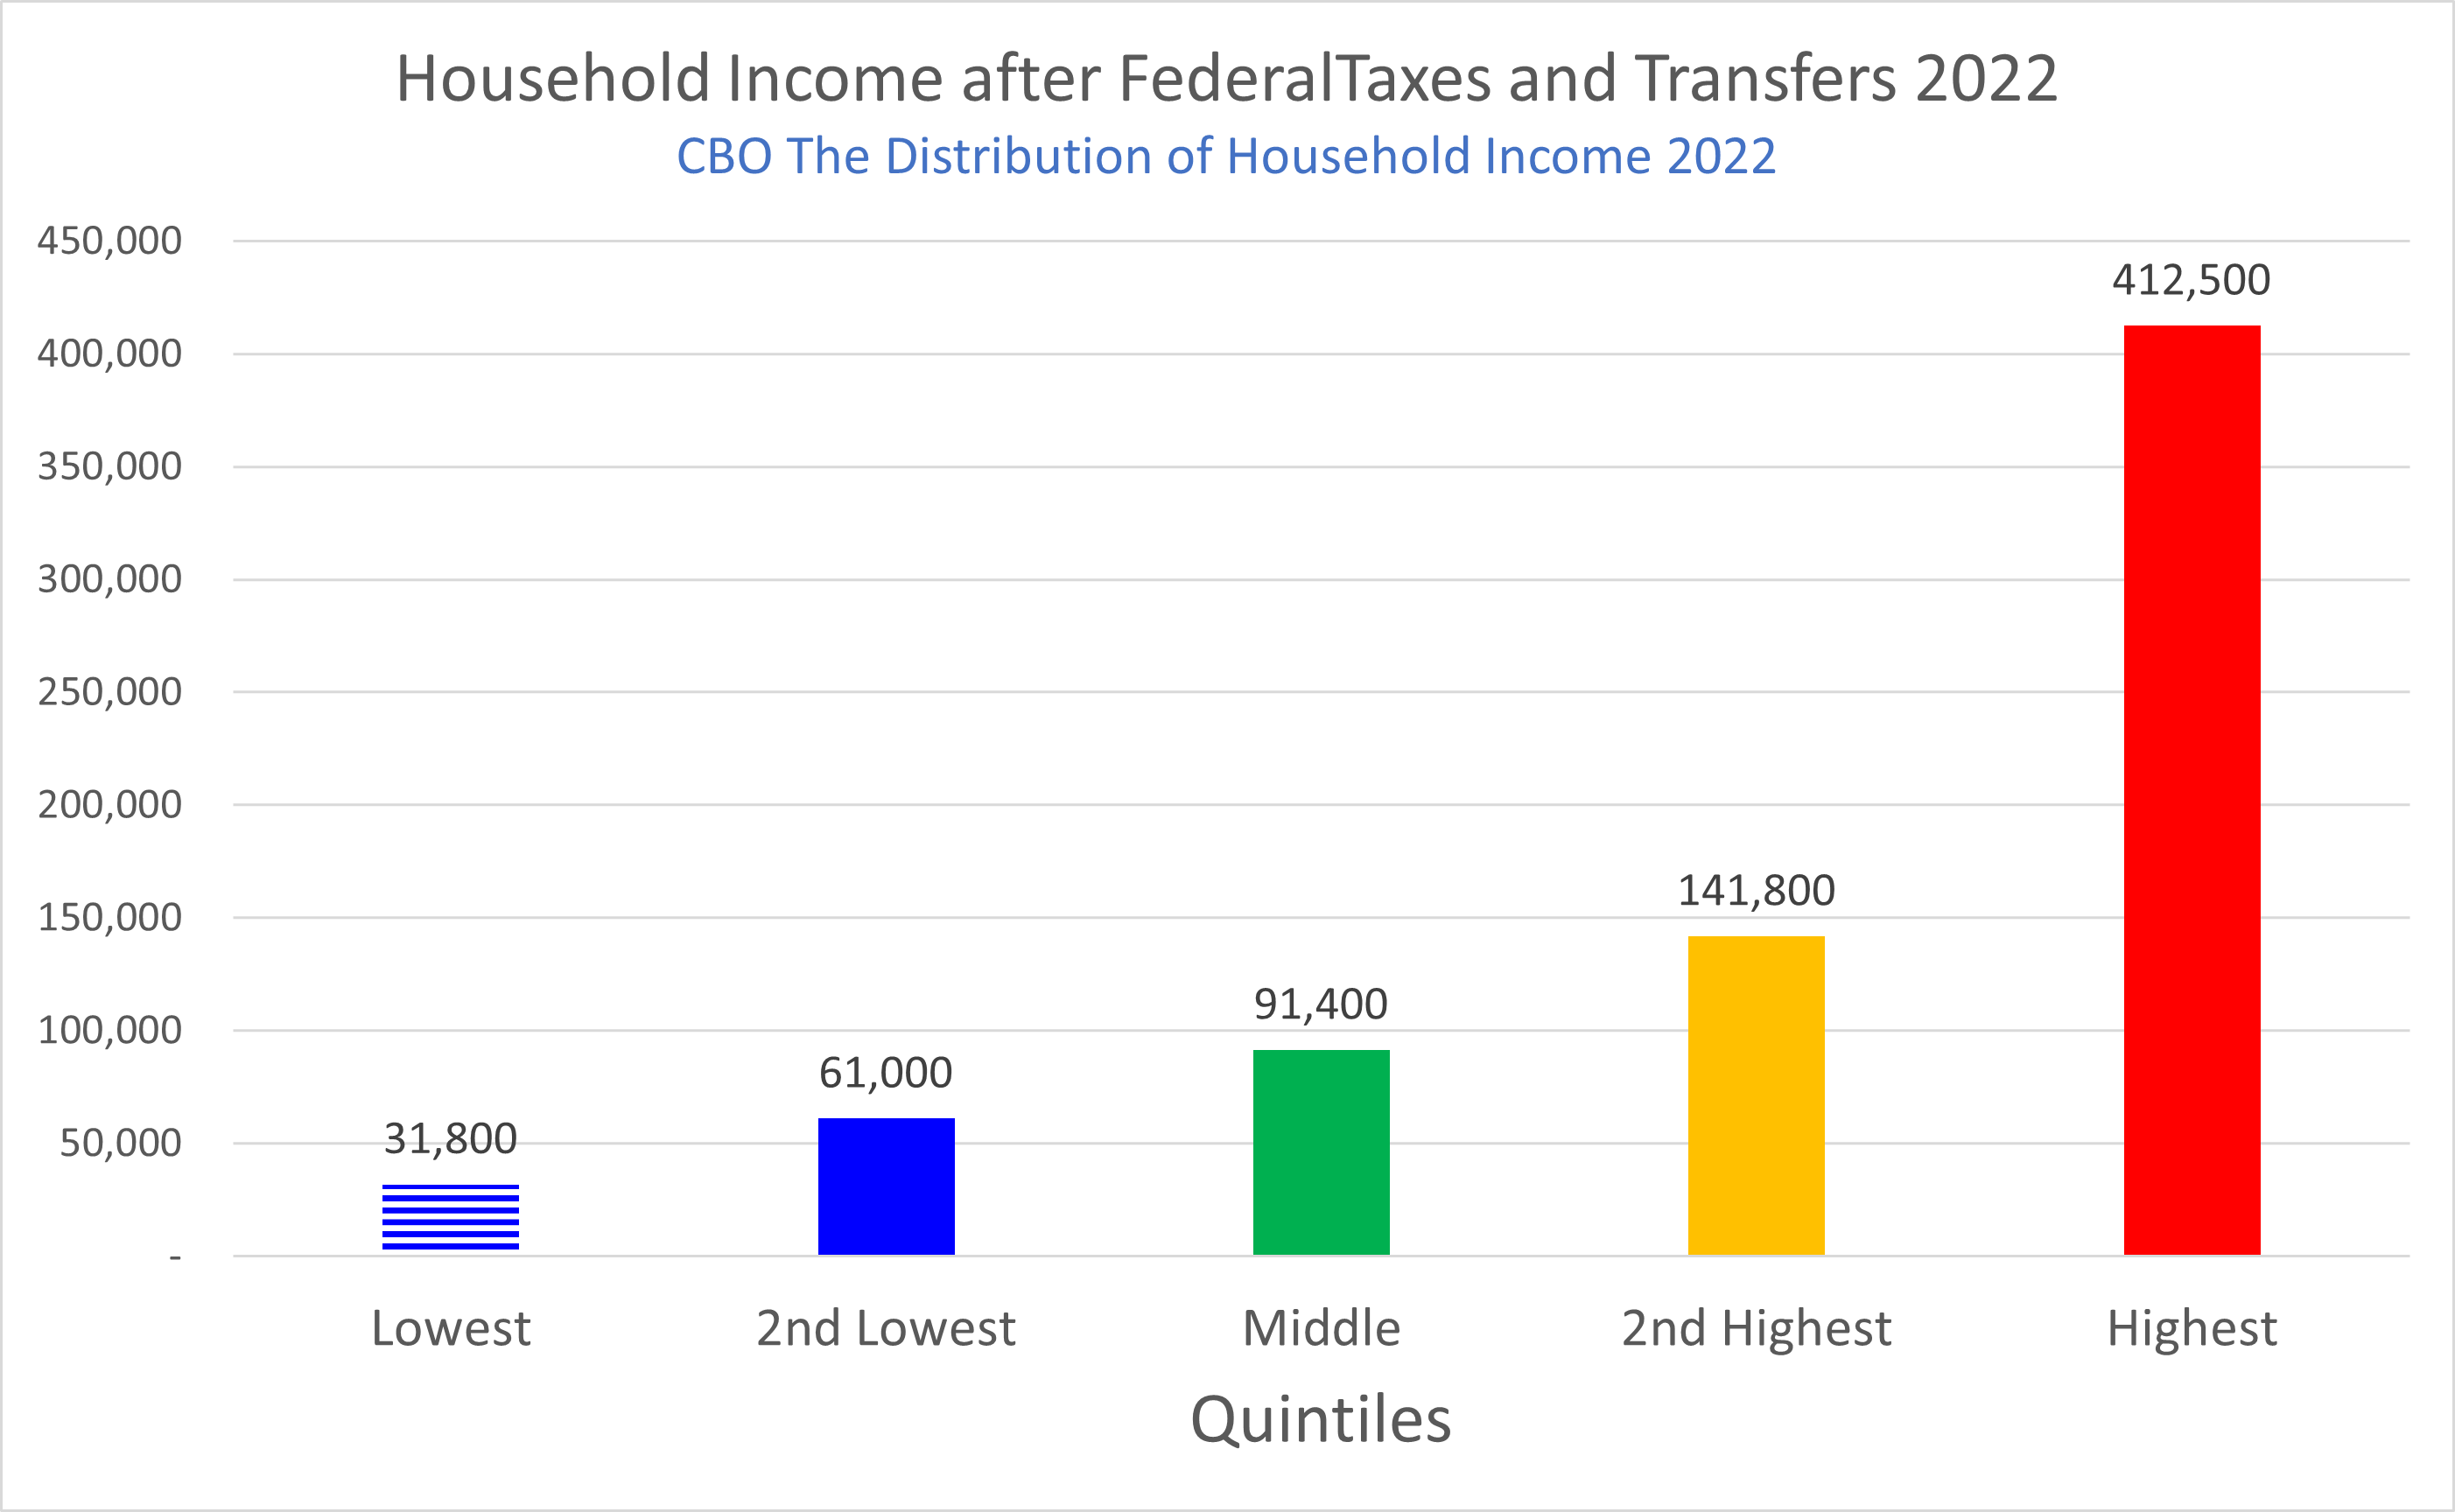
The summary above shows that in 2022 there was a progressive tax rate with higher income households paying higher tax rates. The lowest quintile of household paid 7.5% of income as Federal tax and the highest 1% paid 31.1%. This summary also illustrates that the highest quintile pays a share of taxes, 69%, that is significantly higher than their share of income, 55%.
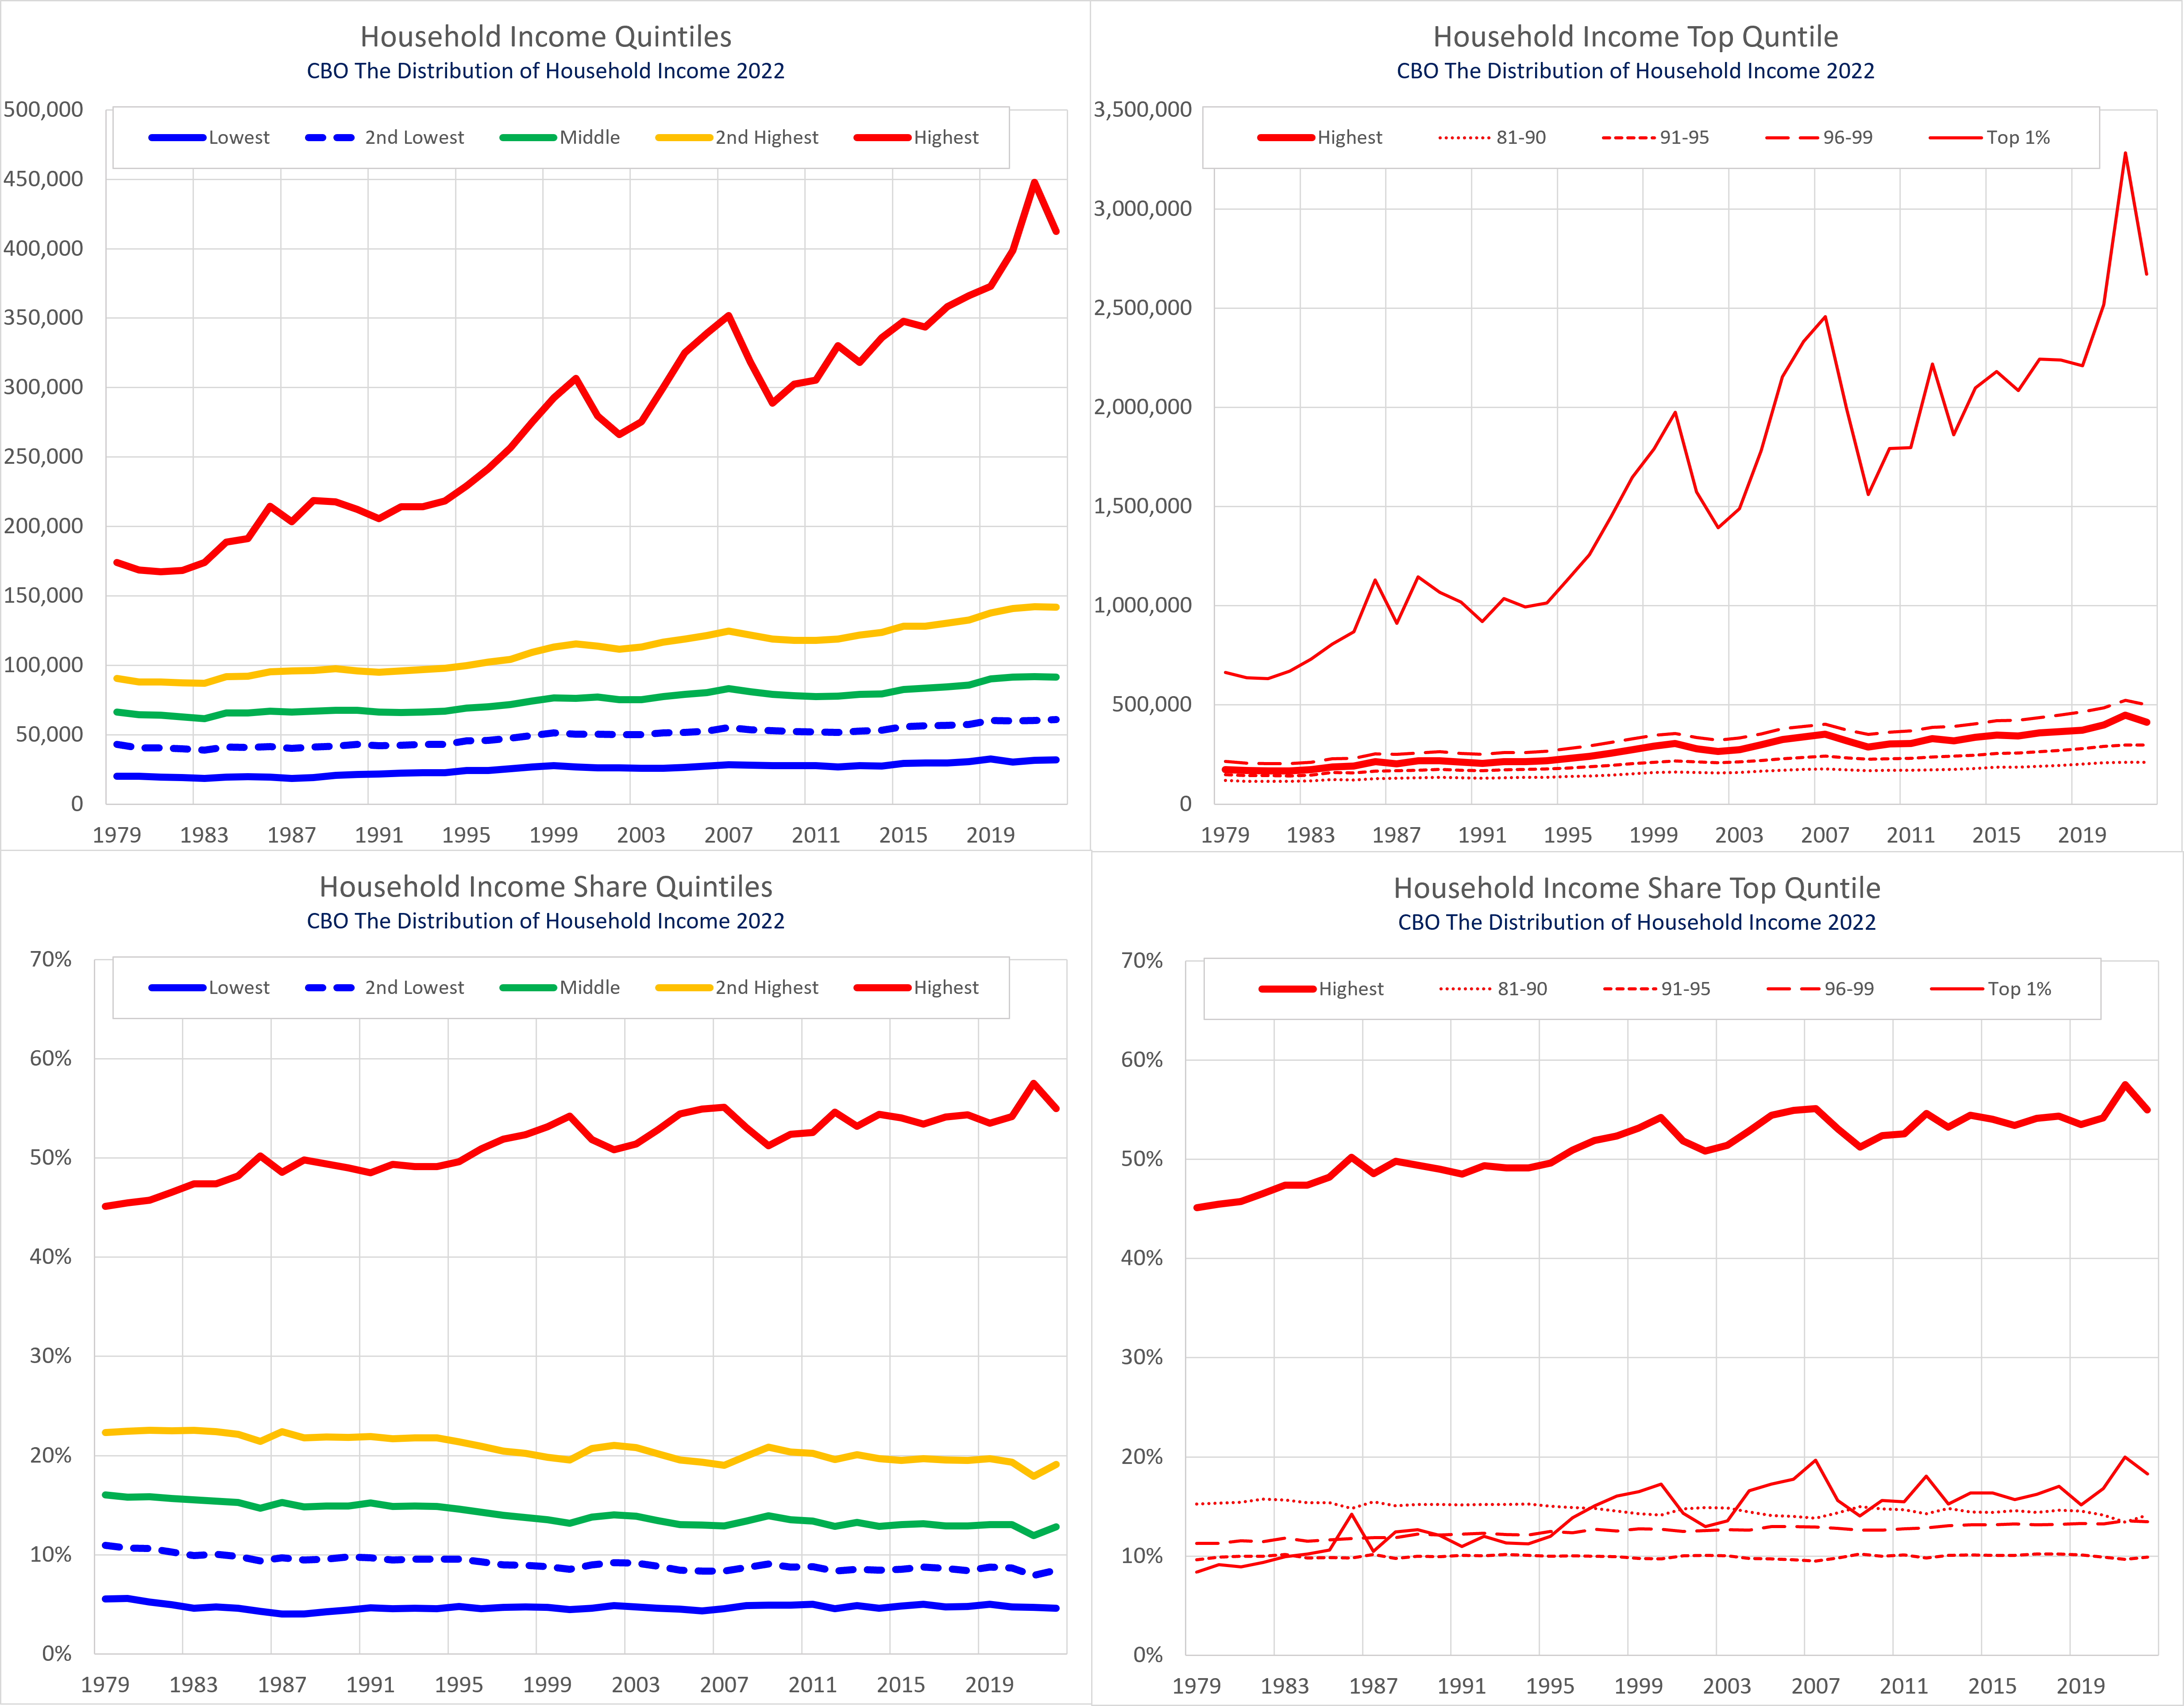
The chart below of Household income and share of Household income illustrate that while all income groups have increasing incomes, the disparities between higher income and lower income households continues to widen.
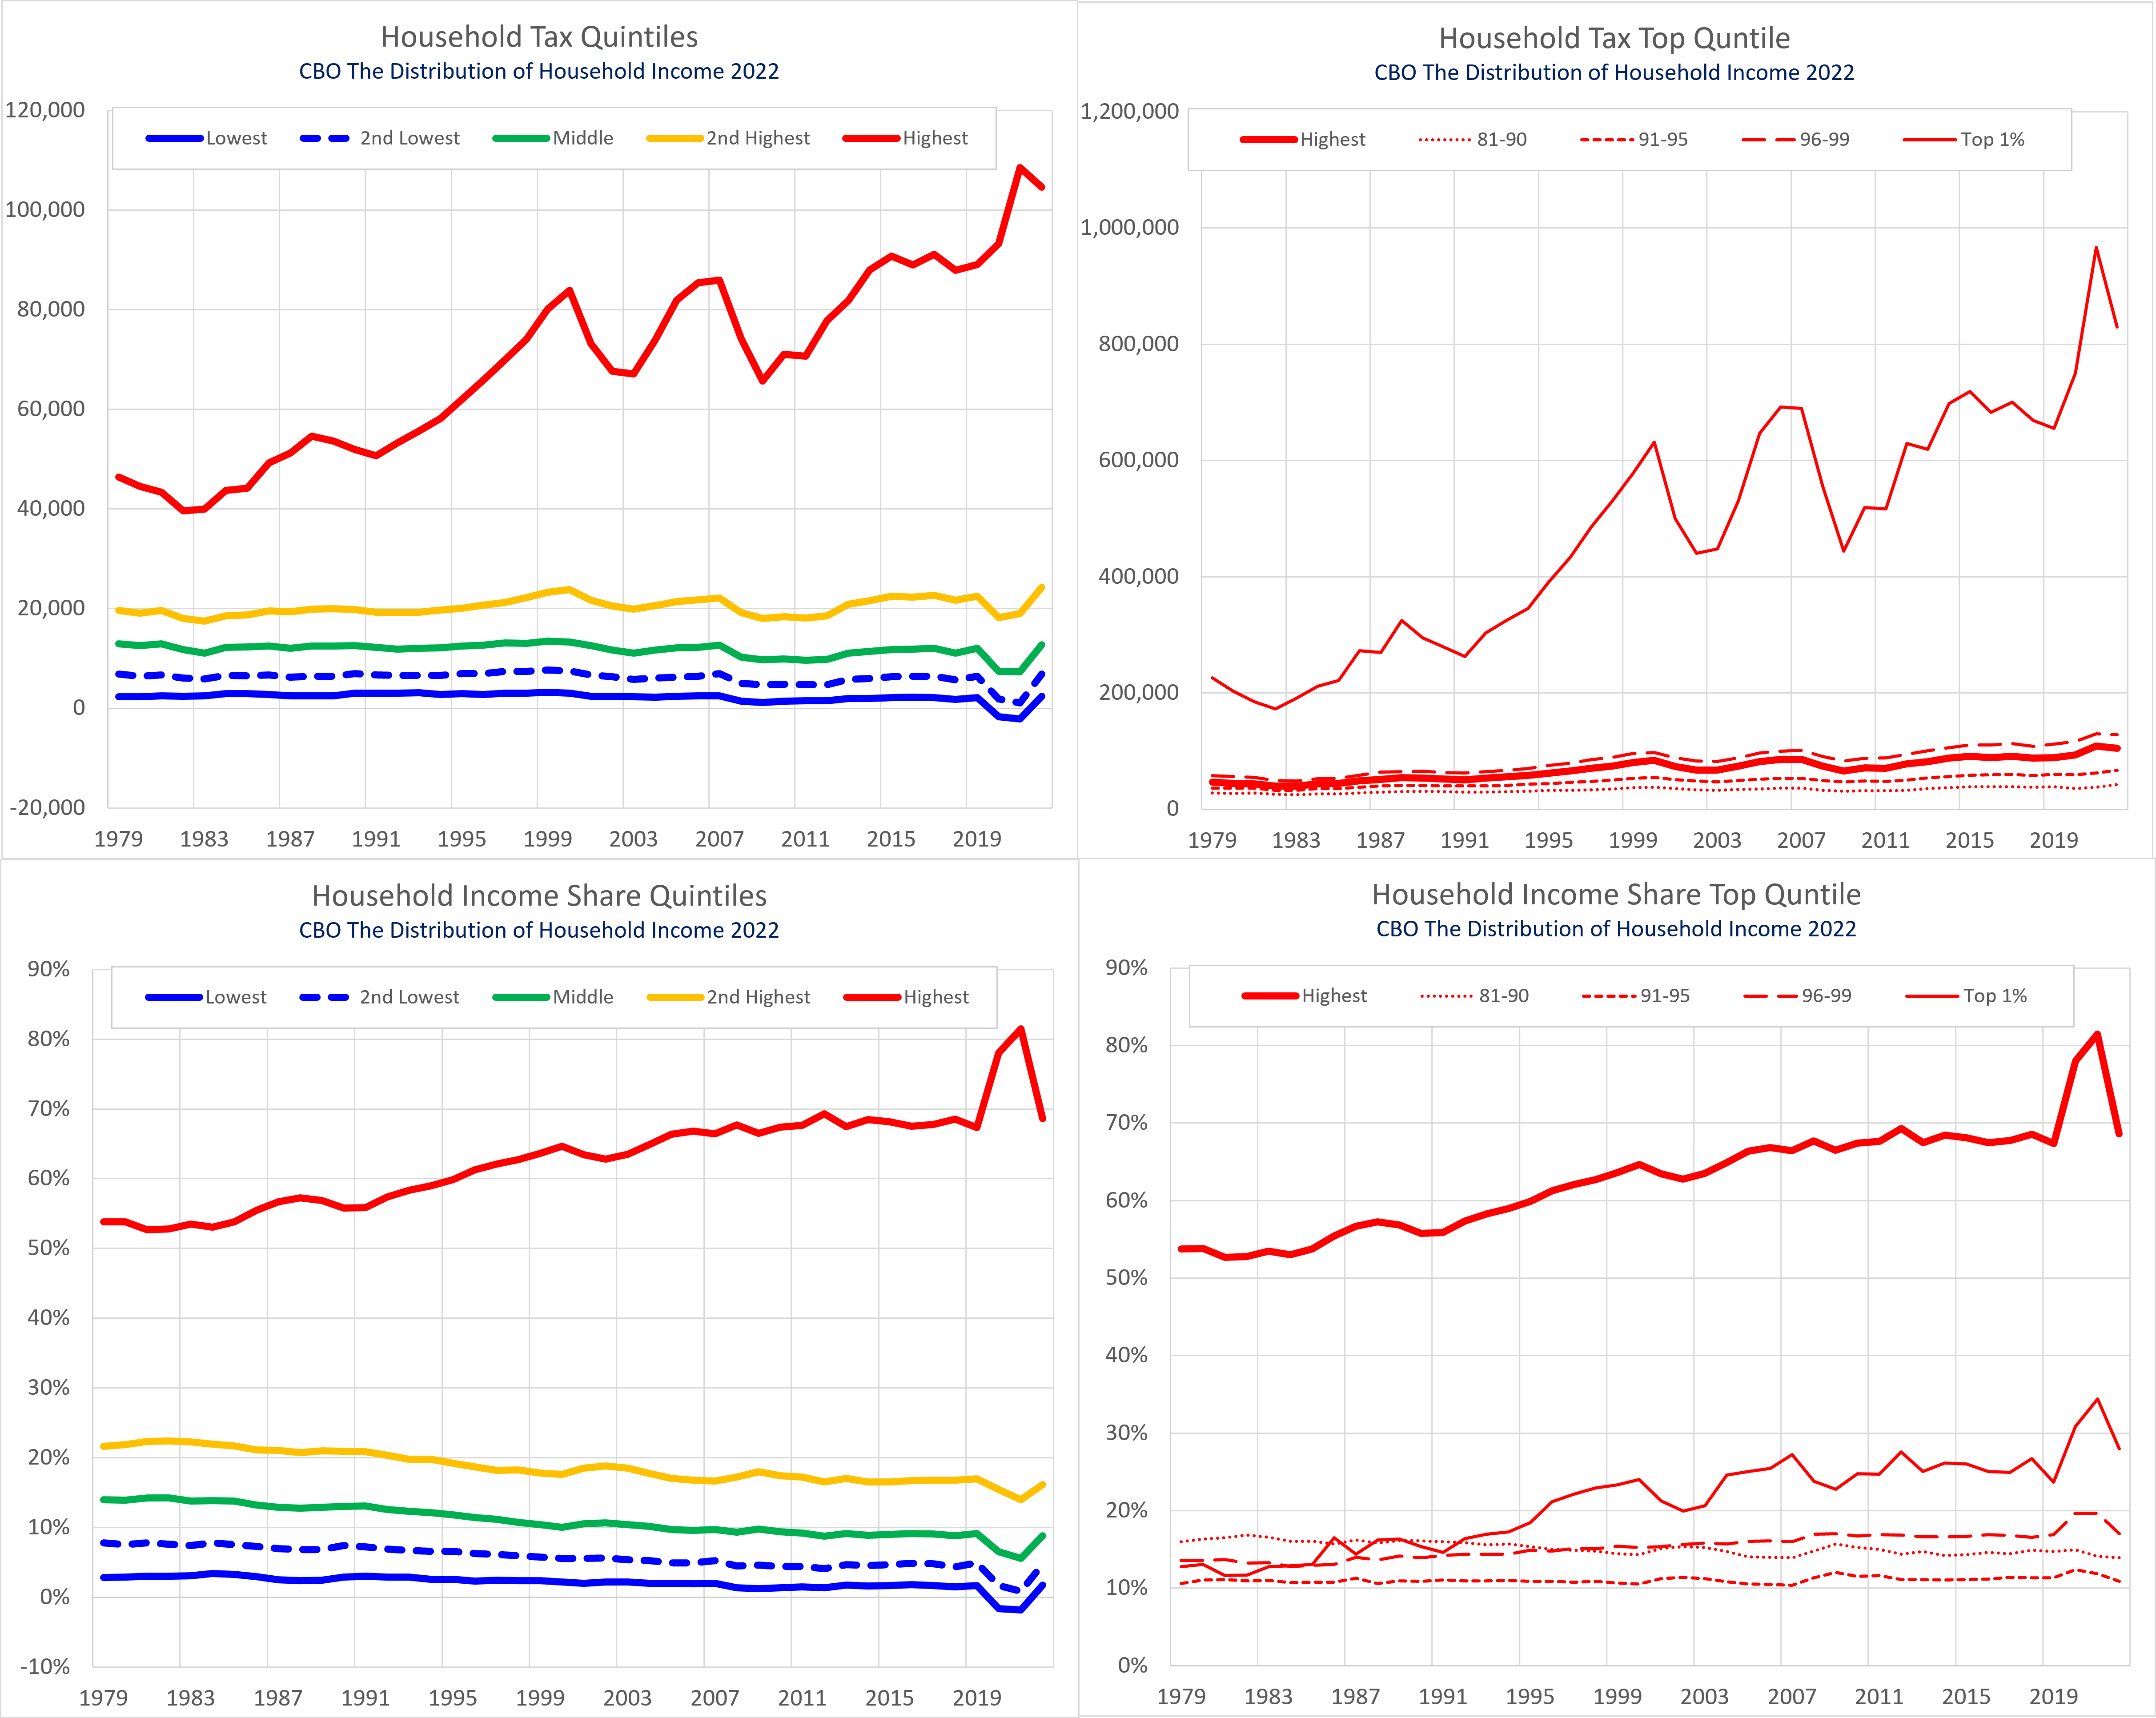
The chart below of Household tax share of Household tax illustrate that the four lowest quintiles of income groups have paid a relatively consistent amount of tax. However, it also illustrates that the top 1% of households have paid a significantly increasing amount of taxes and that the top 5% have paid a significantly increasing amount and share of taxes.
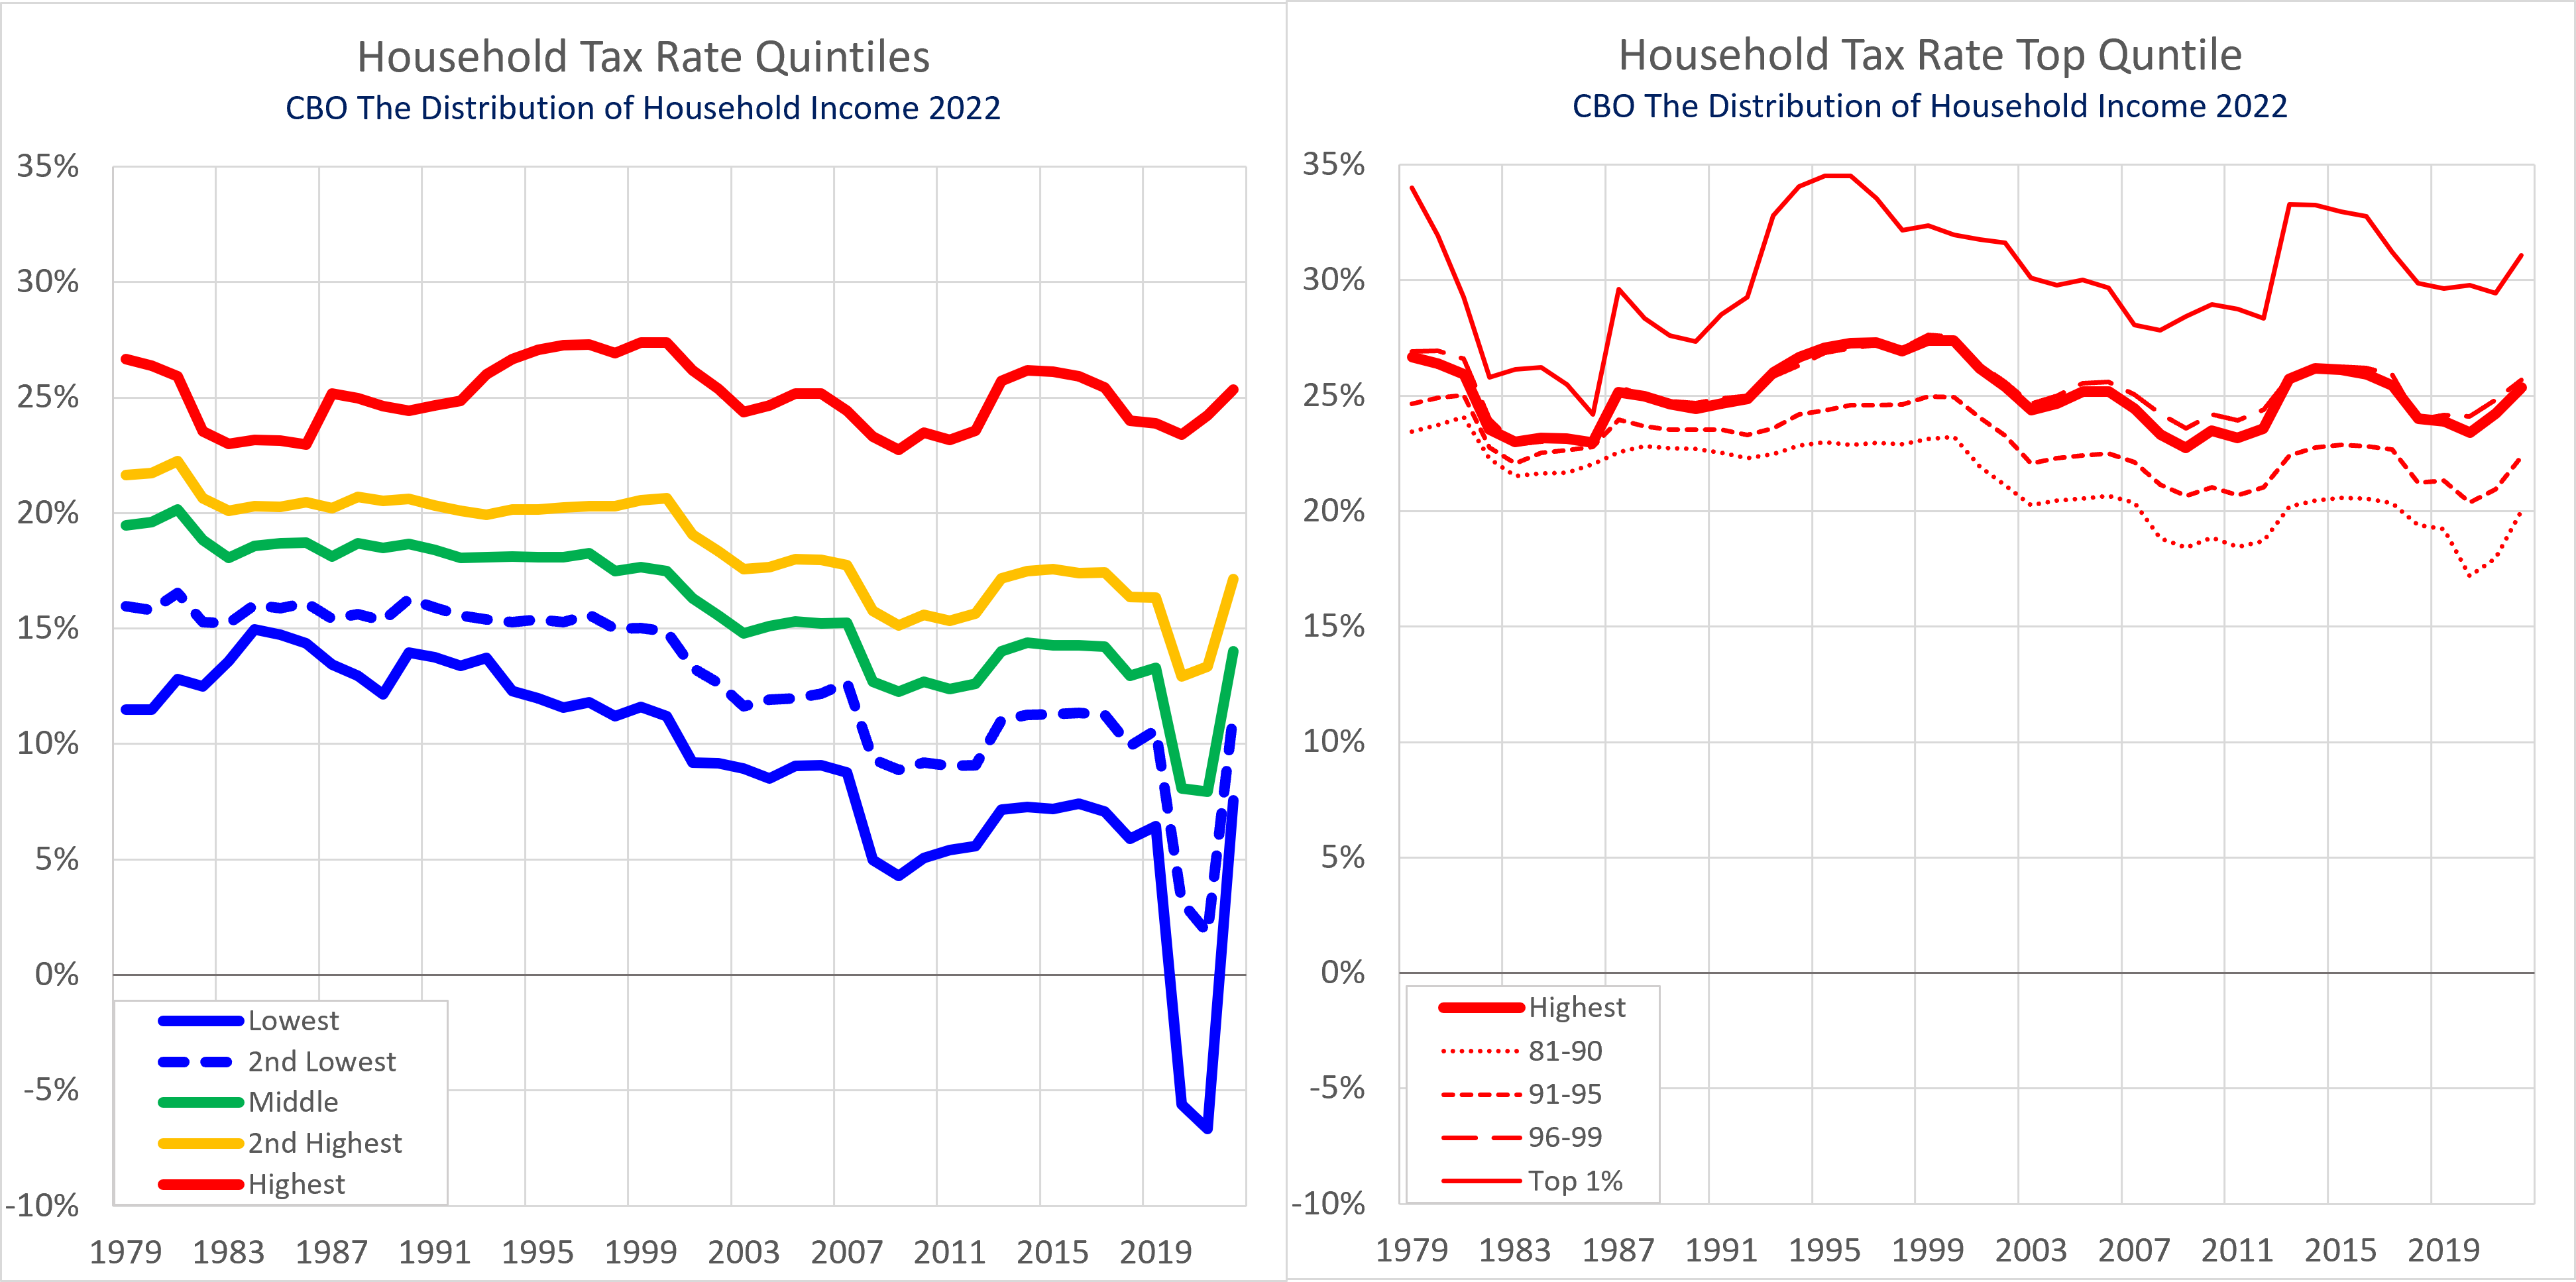
The chart below illustrates one of the factors behind these trends as it shows that tax rates for the highest incomes have remained relatively flat while the tax rates of the other four quintiles continue to trend down.
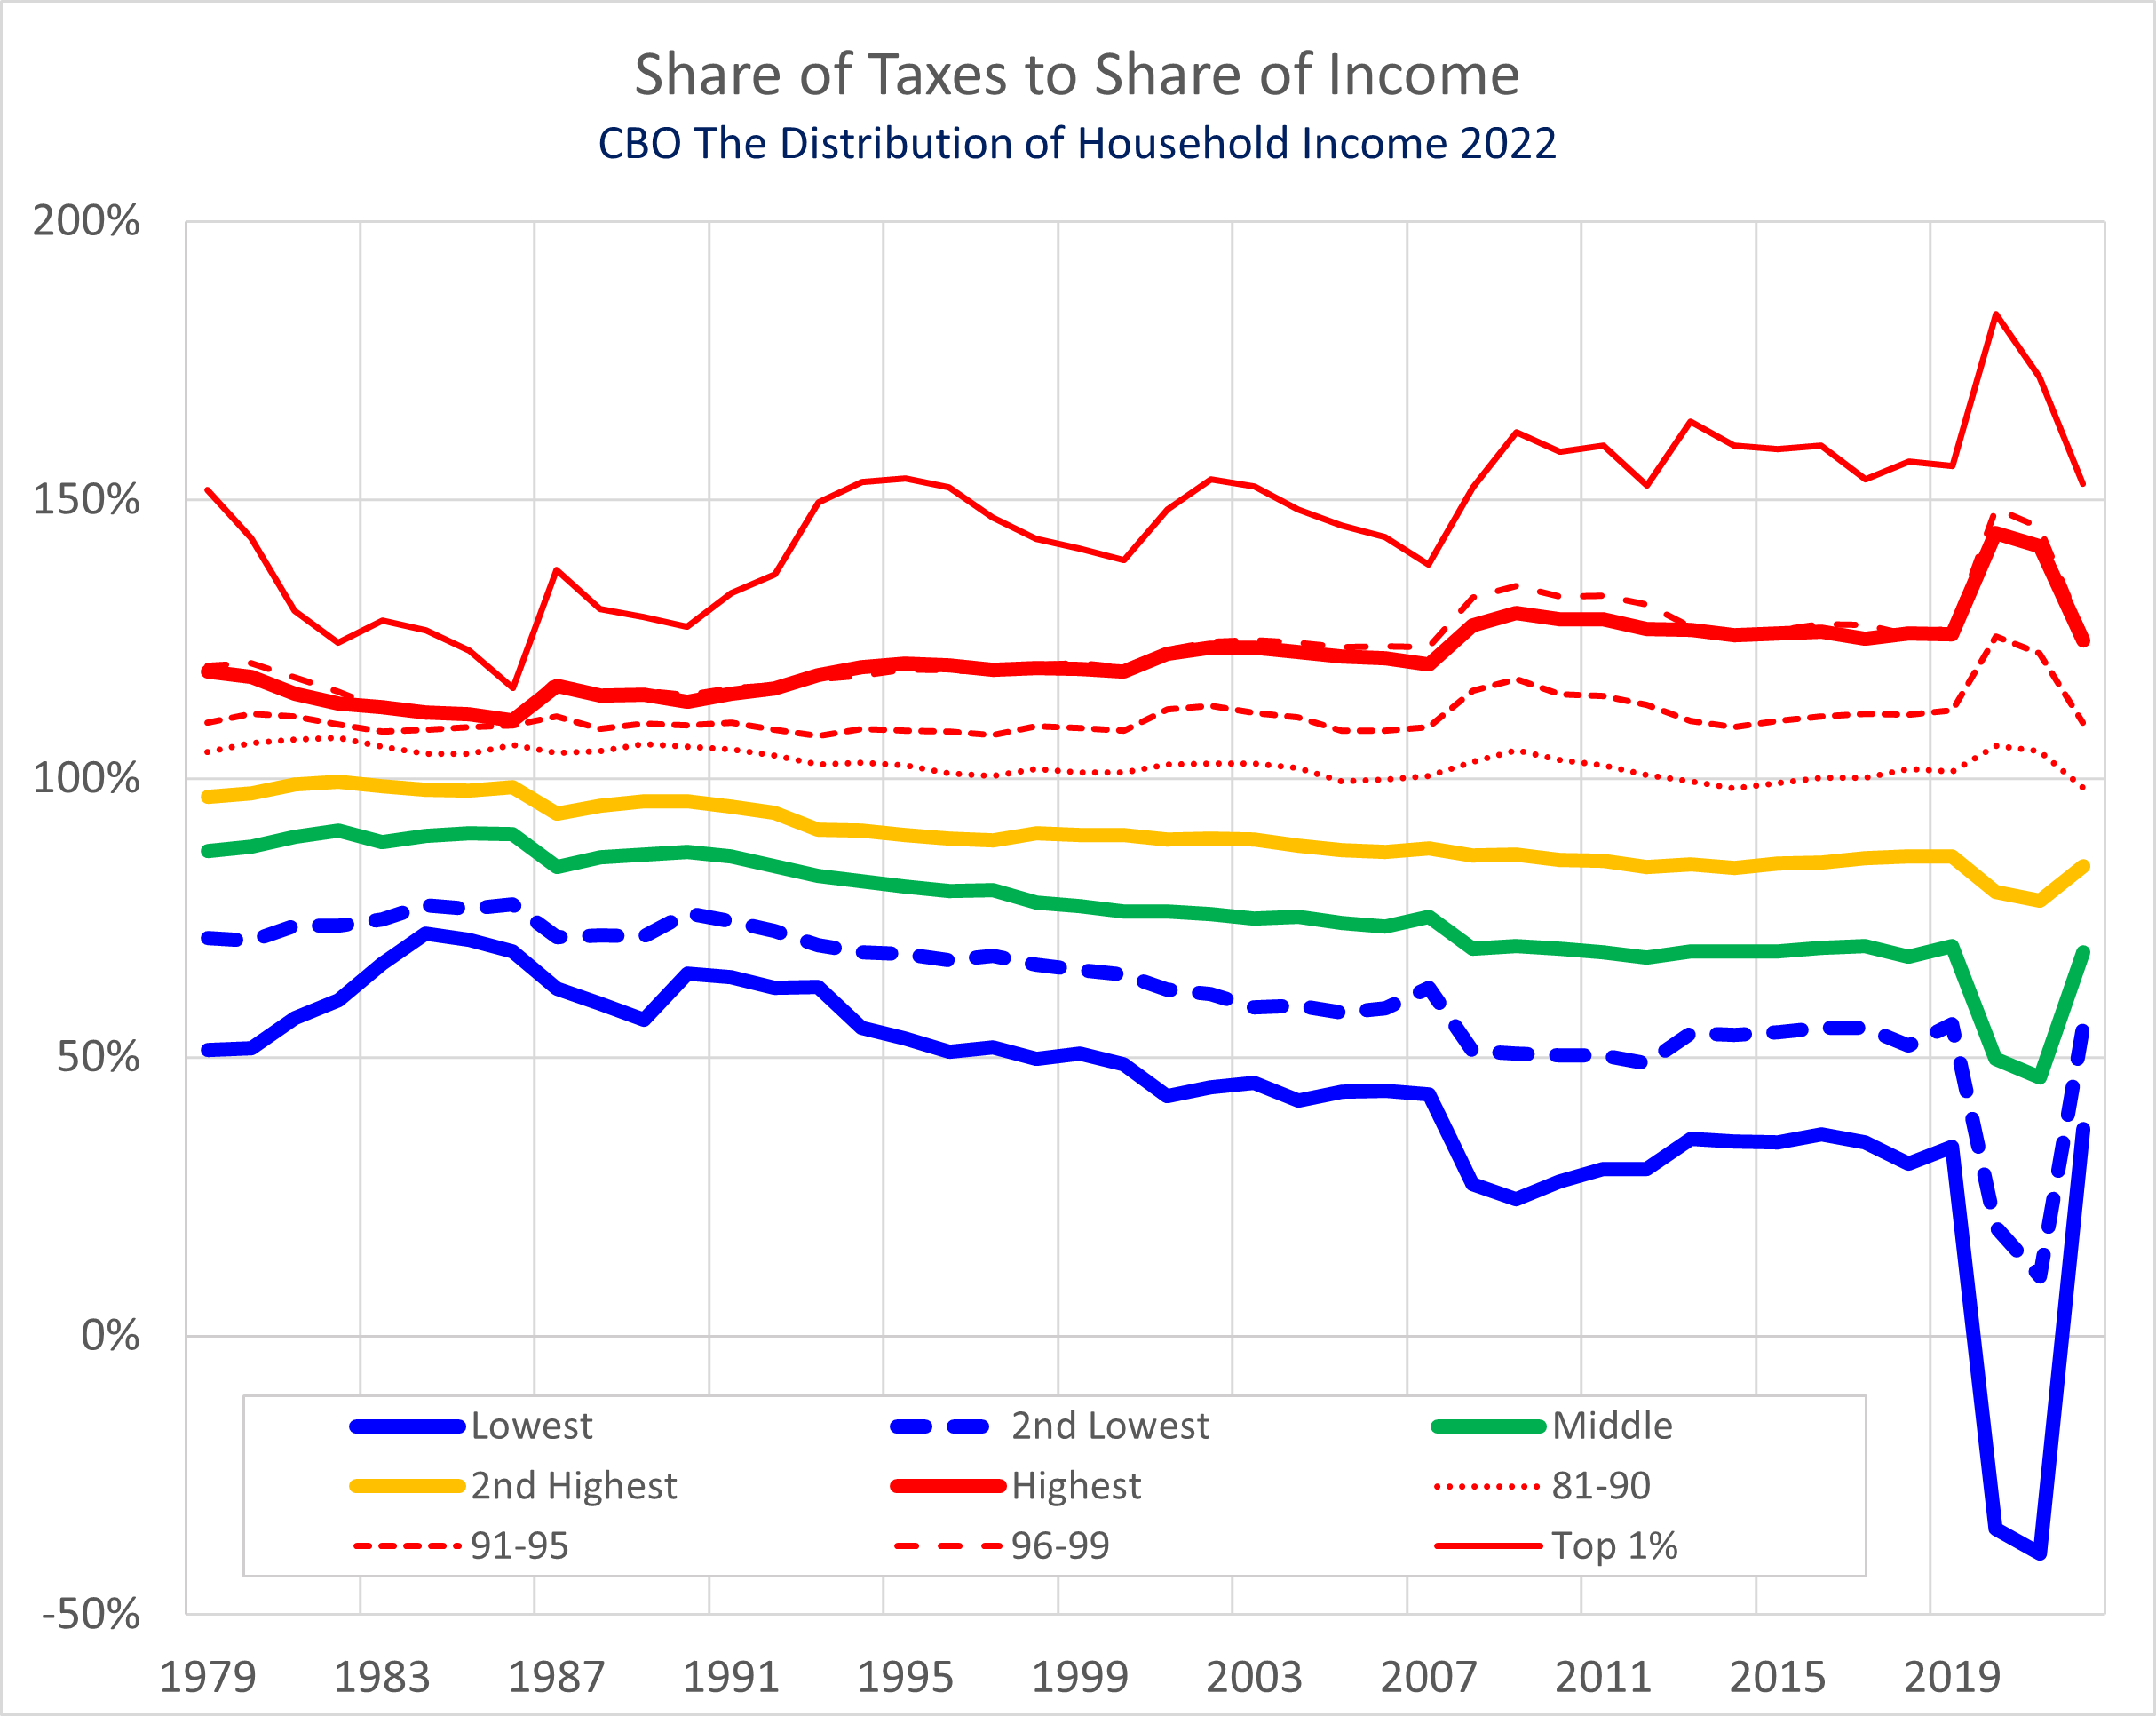
The chart below shows the ratio of share of taxes to share of income. It shows that the trend of the highest income households paying an increasing share of taxes related to their share of income continues with the lower four quintiles continuing to see a trend lower in this ratio.
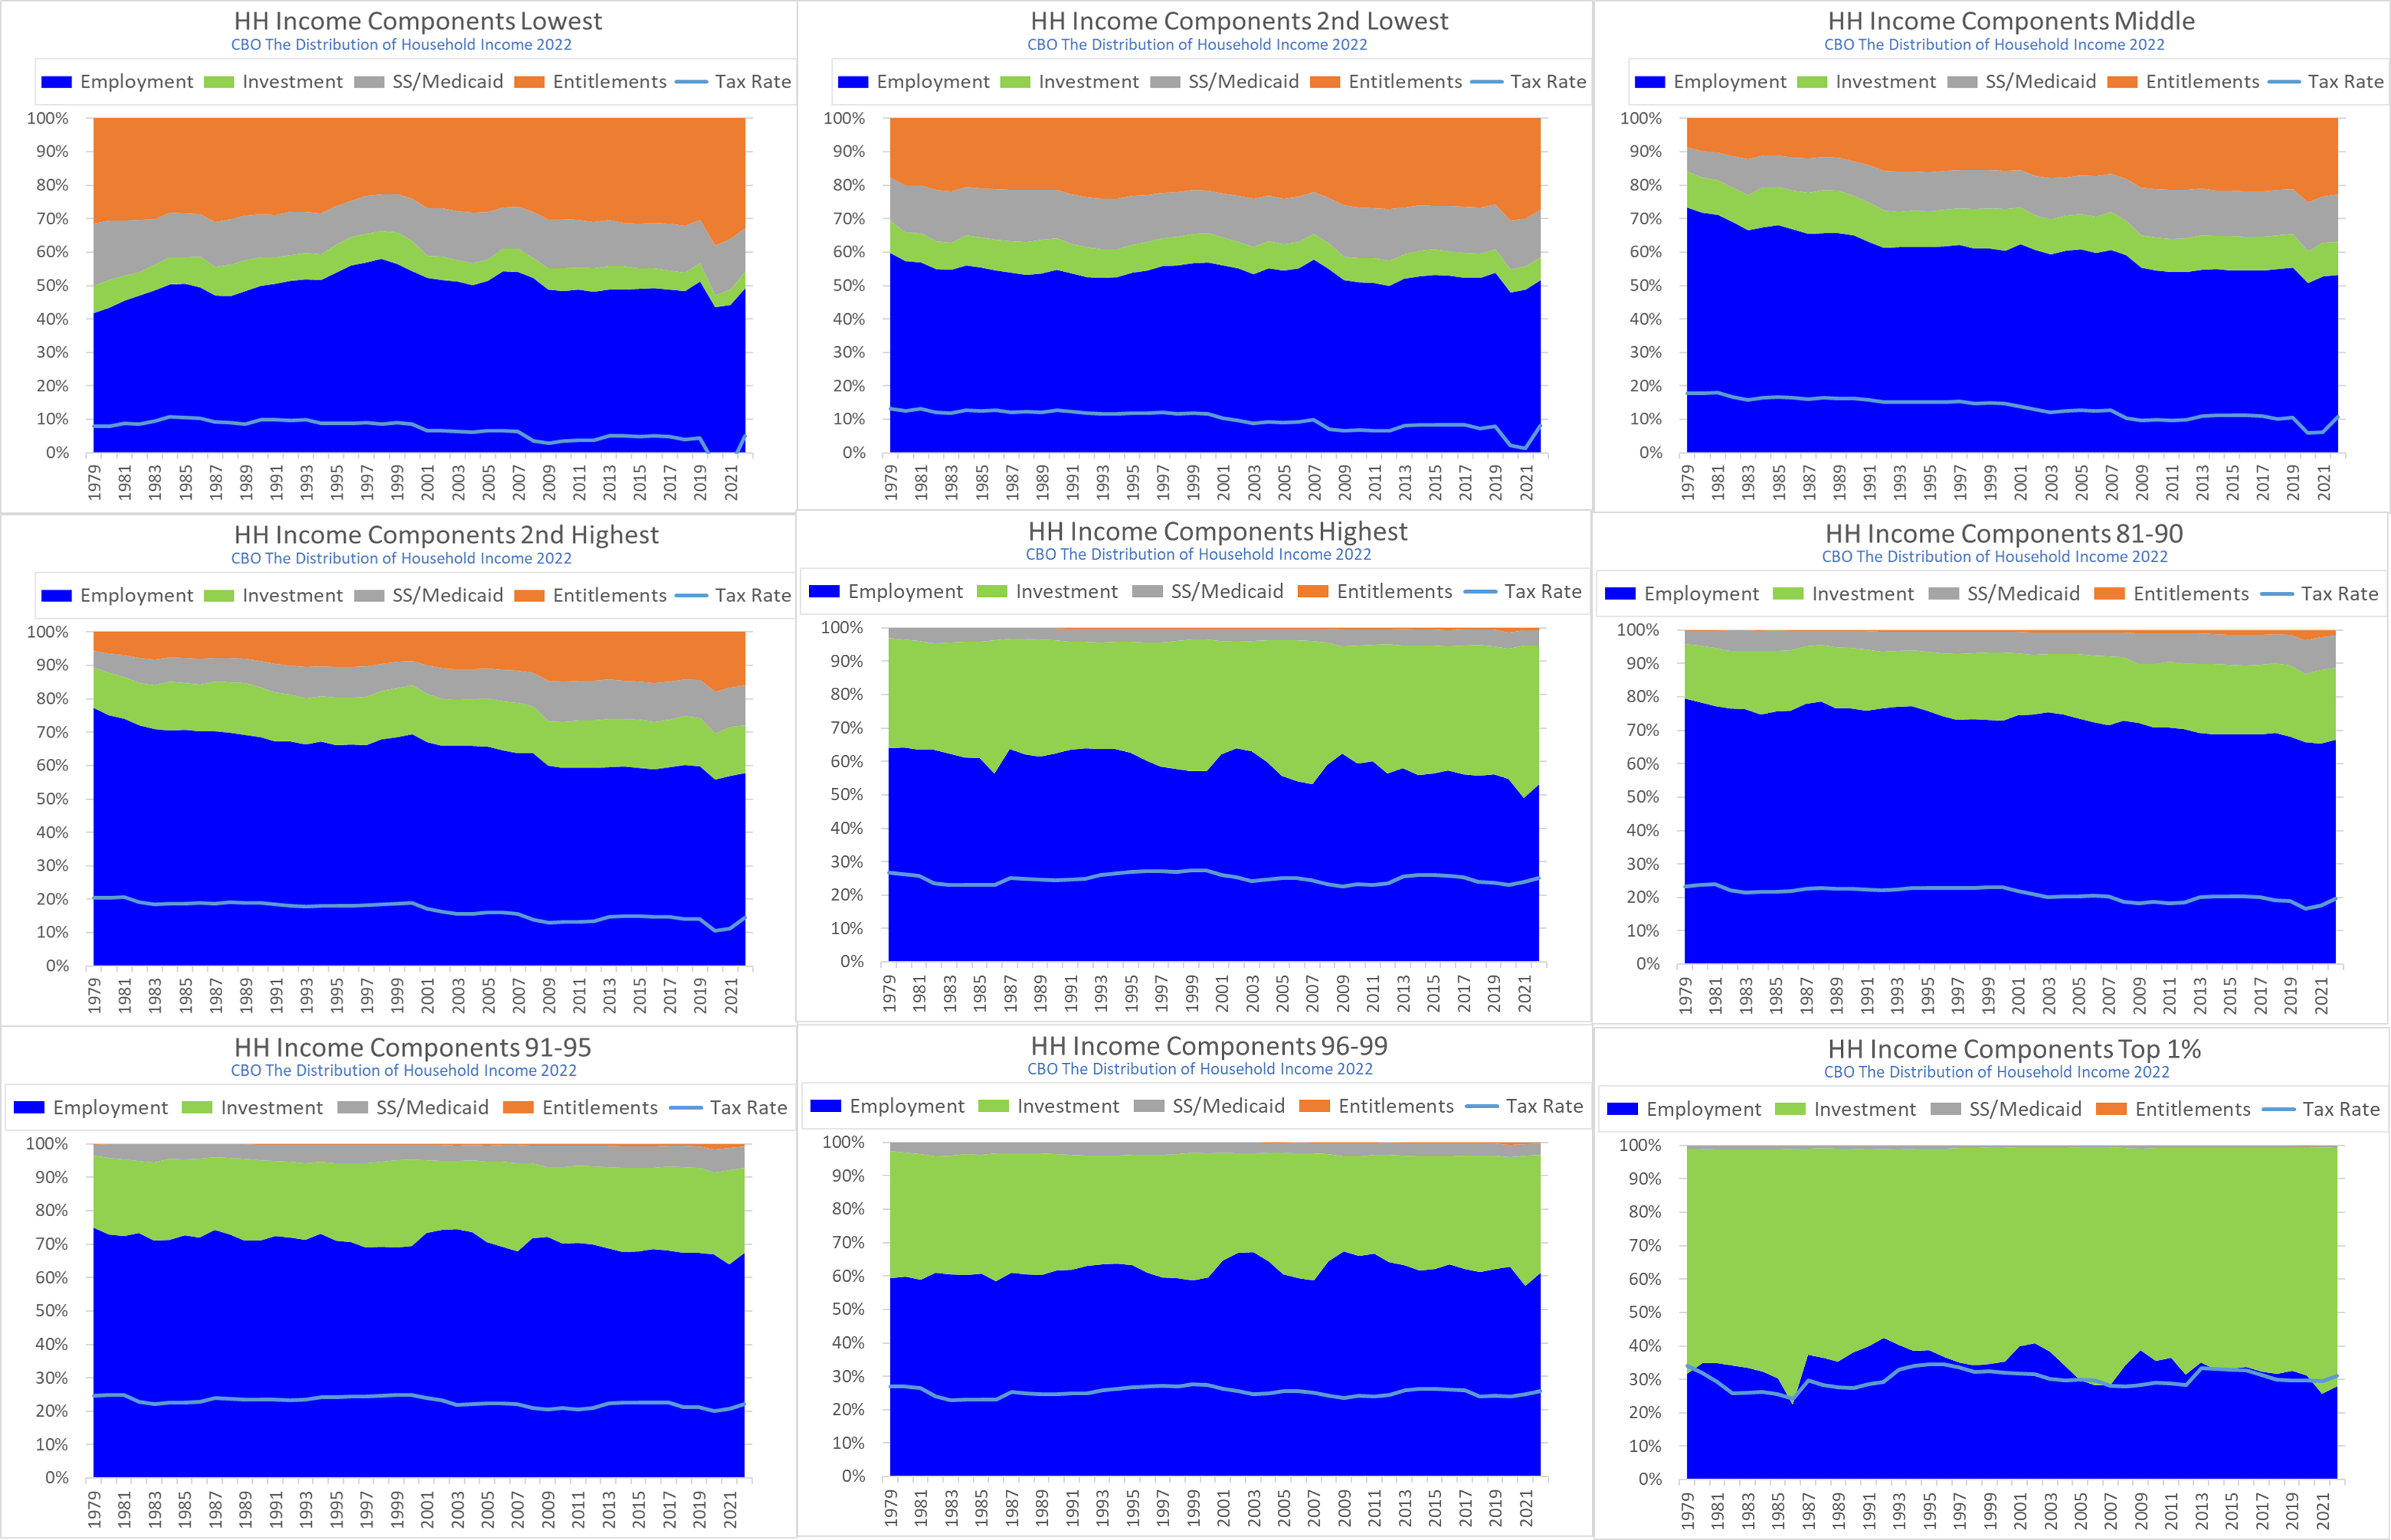
Below is a chart showing the components of Household income: employment, investment, Social Security and Medicaid, and entitlements. As other sources of income increase, entitlements become a much smaller percent of income. Also illustrated is the increasing share of investment income with it becoming the far largest in the top 1%. Taxes as a share of income is also shown.
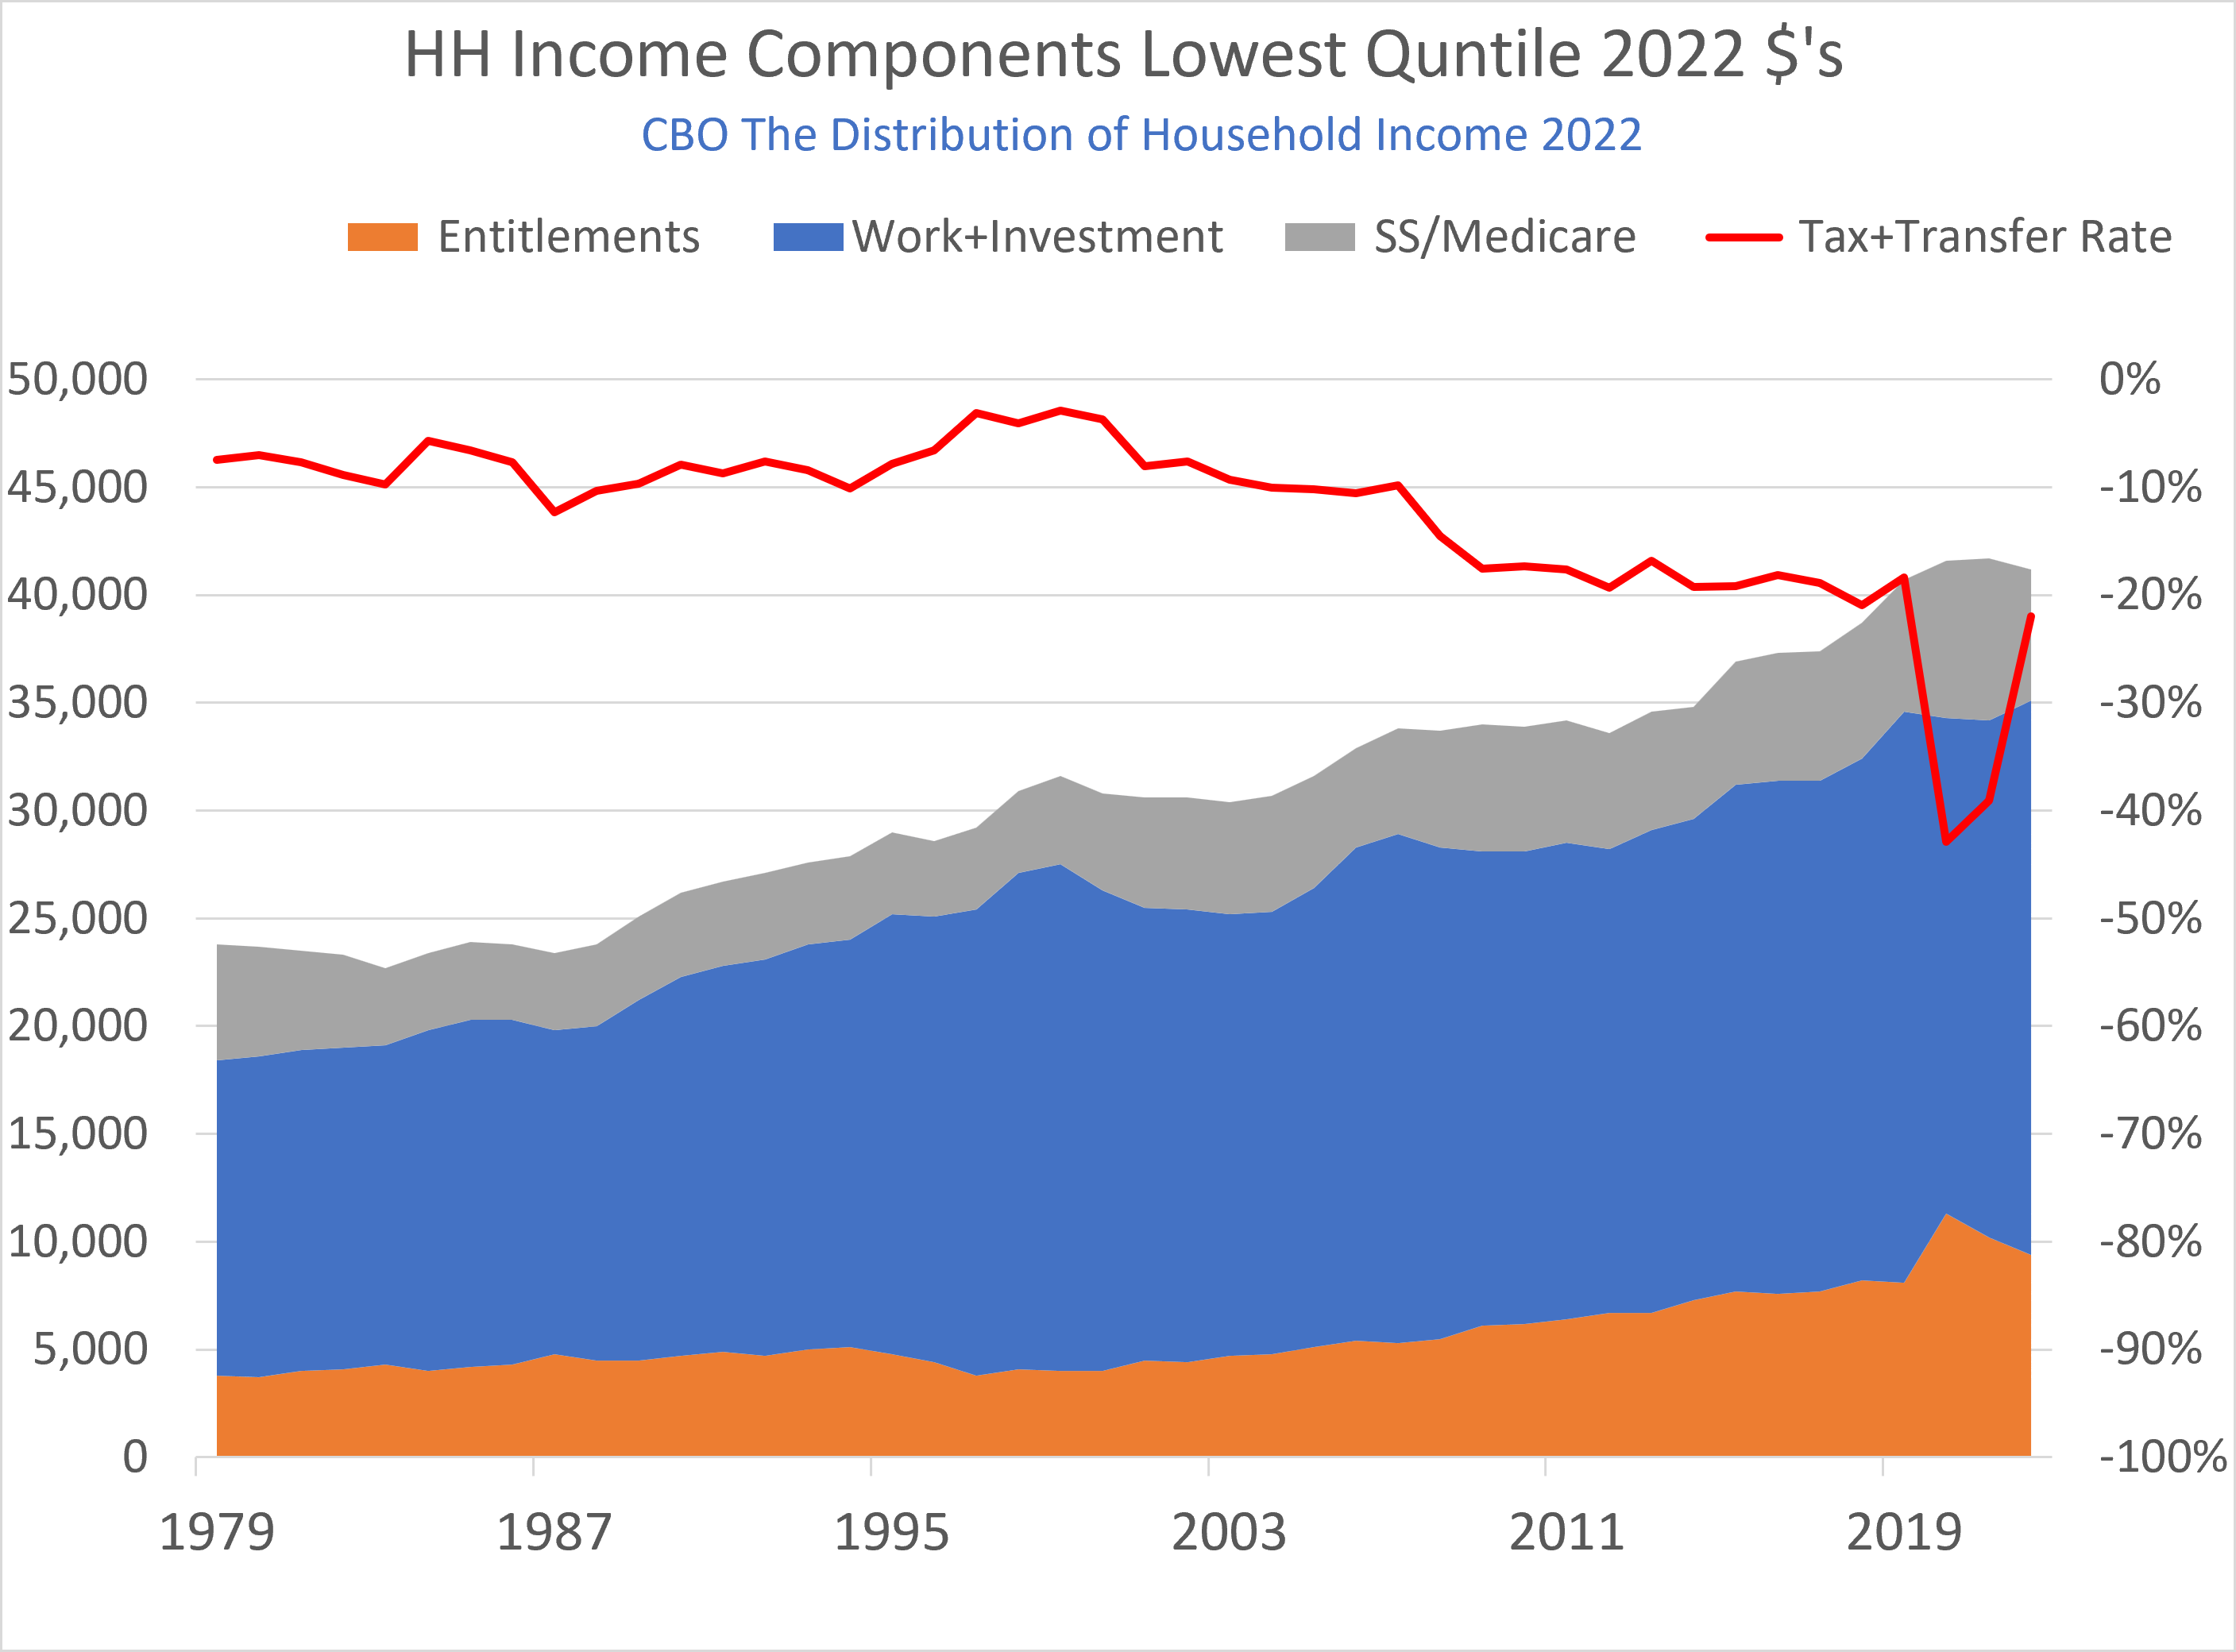
The final chart illustrates the large percentage of Government related income in the lowest quintile.
Not based on the CBO report and not recently updated is the chart below showing marginal tax rate at lower incomes. Concerning is that the way that tax credits and various entitlements are designed, there is the perverse incentive not to earn more for the poorest as they are implicitly taxed through loss of entitlements and credits resulting in very high effective tax rates of almost 100%.
